
July 2022
Future Forum Pulse
Summer Snapshot
New data shows the desire for flexibility has intensified among knowledge workers—and they’re willing to walk to get it
Read through the report by clicking the sections below, or download the full report as a PDF.
Future Forum is a consortium focused on building a way of working that is flexible, inclusive, and connected. We conduct research and convene executives to design a people-centered and digital-first workplace. In June 2020, Future Forum began surveying thousands of workers and managers globally on a quarterly basis, asking them a series of questions related to productivity, sense of belonging, and preferred ways of working. This report summarizes the findings of the Summer 2022 Future Forum Pulse, a survey of 10,646 knowledge workers across the U.S., Australia, France, Germany, Japan, and the U.K., conducted from May 2 to 16, 2022.
The data shows that full-time in-office workers report markedly lower employee experience scores compared to hybrid and full-time remote workers, as the number of knowledge workers who want to be in the office full-time dropped to 20%, the lowest point in two years of surveying.
“Today’s workplace environment is centered around flexibility, and employees without it remain at a strong risk of attrition,” said Brian Elliott, Executive Leader of Future Forum. “Companies looking to build productive, successful teams need to think about how they provide flexibility not only in where but also when people work.”
This summer snapshot of Future Forum’s latest global Pulse survey answers the key questions that business leaders are asking as they navigate how to implement flexible work policies and create a workplace where all employees can thrive.
Where are people working?
The trend of knowledge workers being pulled back into the physical office held steady this quarter. Thirty-four percent of knowledge workers say they’re working full-time from the office—matching the record high reached in February 2022.
The number of people working in a hybrid arrangement increased four percentage points from 45% to 49%, as those in full-time remote work arrangements dropped from 21% to 18%.
How are people feeling about work?
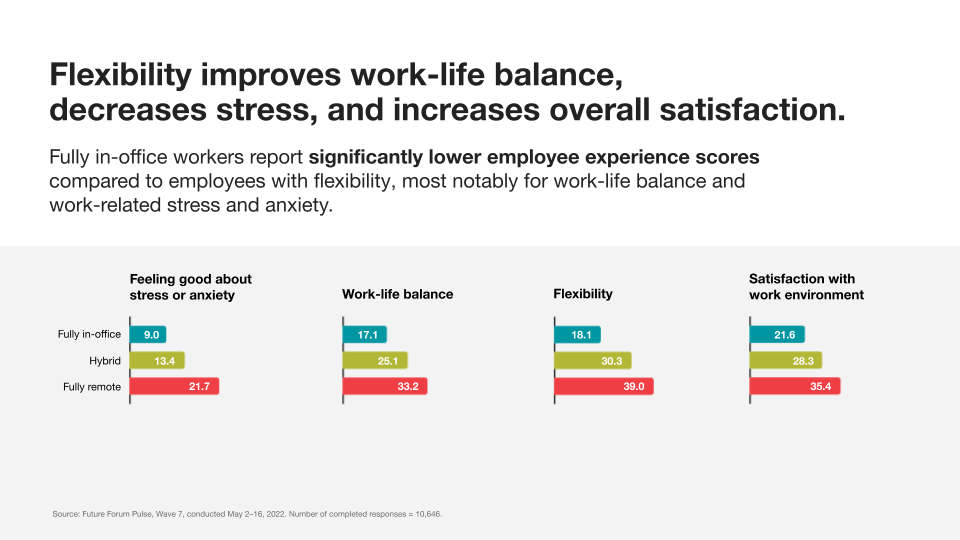
The preference for flexible work reached an all-time high this quarter, with 55% of knowledge workers preferring to work fewer than three days a week in the office, compared to 53% in February 2022. Fully in-office workers are the least satisfied with their working arrangements: they report significantly worse employee experience scores compared to hybrid and full-time remote employees, most notably for work-life balance and work-related stress and anxiety.
The executive-employee disconnect first observed in fall 2021 continues; executives show markedly higher scores for employee experience, including 1.3x higher scores for overall satisfaction with their work environment compared to non-executives. And non-executives reported 1.5x worse work-related stress and anxiety scores compared to executives.
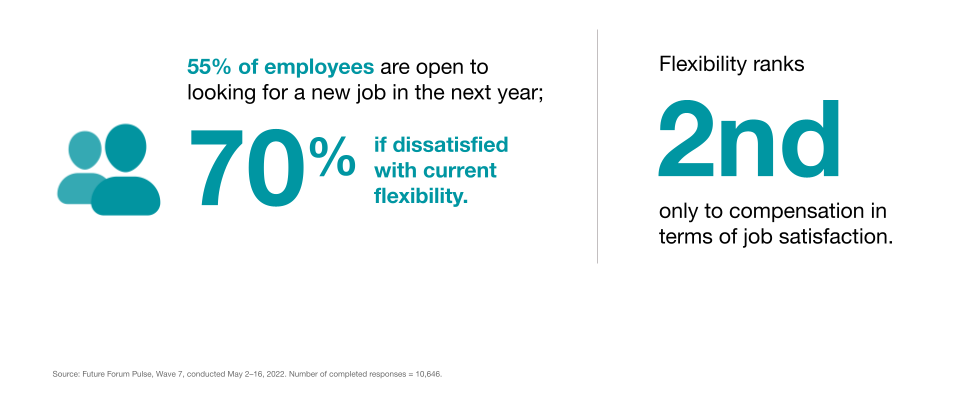
Flexible work policies—not only in where but also when people work—are top of mind for employees globally, and flexibility still ranks second only to compensation in terms of job satisfaction.
How do knowledge workers feel about flexible work?
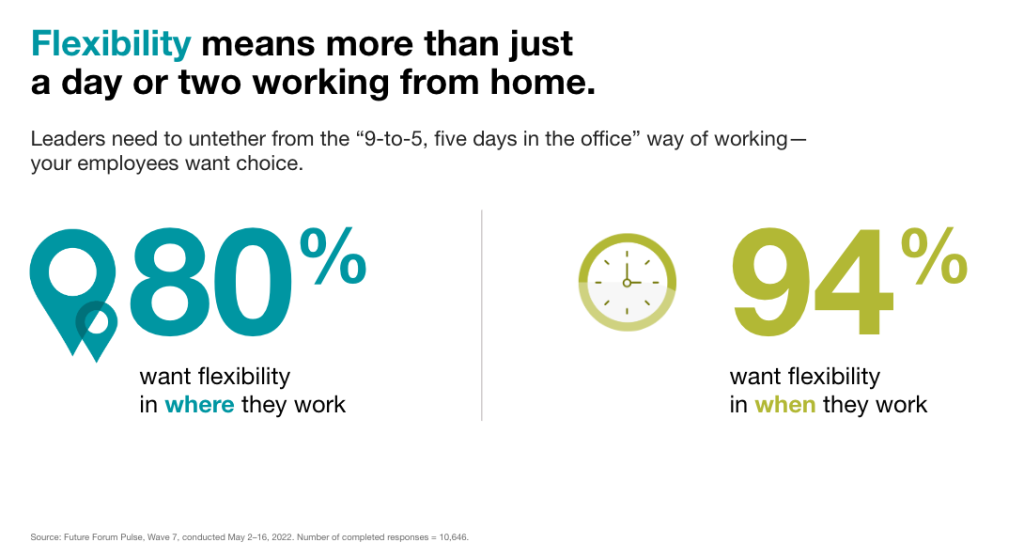
- 80% of all knowledge workers now want flexibility in where they work, including a majority (53%) of fully in-office workers.
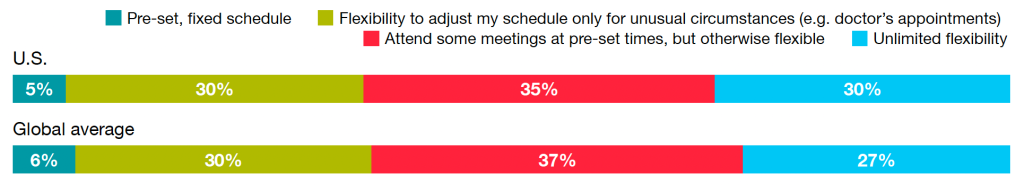
- 94% of employees want flexibility in when they work, a continuing trend from Future Forum’s previous quarterly survey. However, 57% of employees say they have little to no ability to adjust their hours from a preset schedule.
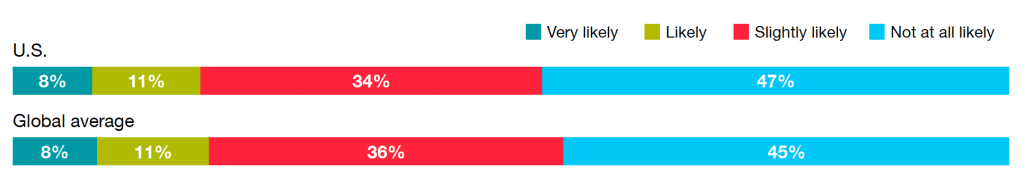
- 55% of employees surveyed are open to looking for a new job in the next year. But among those who say they are dissatisfied with their level of flexibility, 70% will look for a new opportunity.
Lack of schedule flexibility dramatically impacts employee experience scores. Compared to those with moderate schedule flexibility, knowledge workers who say they have little to no ability to set their own hours report:
- 3.4x worse work-related stress and anxiety
- 2.2x worse work-life balance
Employees with rigid work schedules also say they are 3x more likely to “definitely” look for a new job in the next year (up from 2.6x in February).
Flexible work practices are a key component in building inclusive workplaces. While diversity, equity, and inclusion has been a priority for executives over the past two years, it’s important to recognize that future-of-work planning and practices fostering workplace belonging must go hand in hand.
“Underrepresented employees want flexibility in both where and when they work,” said Sheela Subramanian, Vice President and Co-Founder of Future Forum. “These employees are crucial to the success of any organization. They feel a stronger sense of belonging and feel more productive when given the choice of how they want to work.”
“Flexible work policies are foundational to a company’s diversity, equity, and inclusion priorities,” Subramanian said.
How does interest in flexibility differ based on race/ethnicity? (U.S. only)
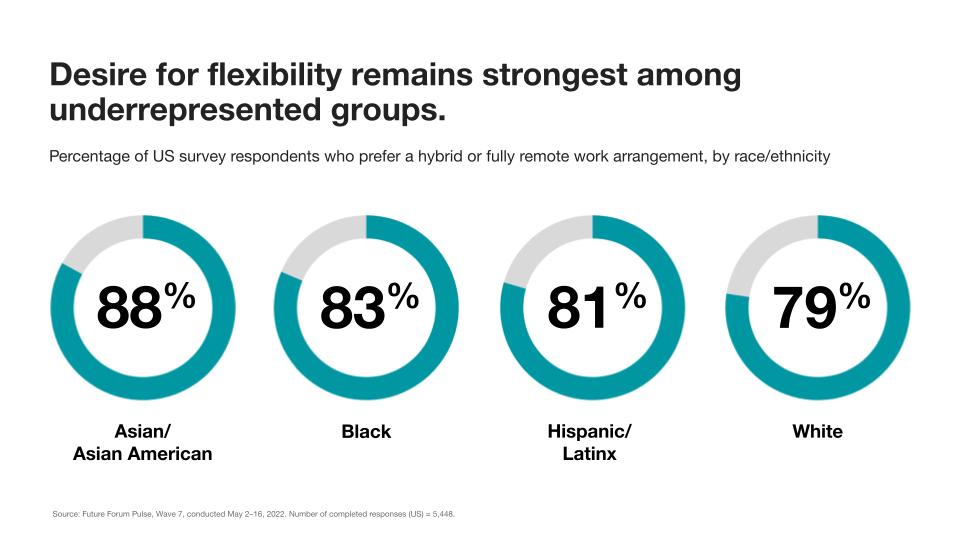
Consistent with our findings quarter over quarter, the desire for flexibility remains strongest among under-represented groups. Based on our recent survey, we continue to see a higher preference for location flexibility among employees of color. The percentage of U.S. respondents by race/ethnicity that prefers these environments: 88% Asian/Asian American (up from 82% in February); 83% Black; 81% Hispanic/Latinx; and 79% White.
How does interest in flexibility differ based on gender/parental status?
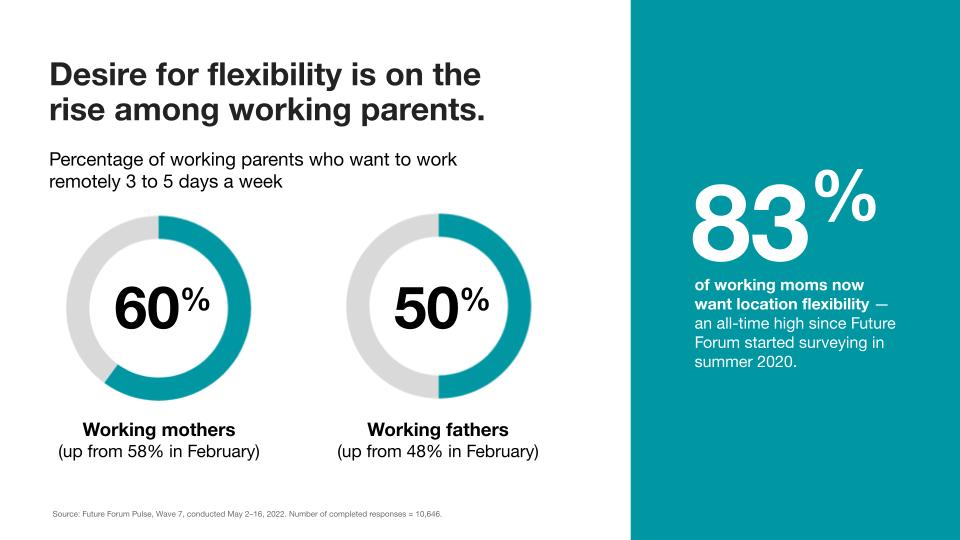
Location flexibility continues to be valuable to parents, including 83% of working mothers—an all-time high for that group. Sixty percent of working mothers now say they want to work outside of the office three to five days a week, up from 58% in February.
And 50% of working fathers want to work outside of the office three to five days a week, up from 48% in February.
To foster connection in a distributed work environment, leaders need to redesign the role of the office and rethink the role of technology to better encourage collaboration in a flexible work environment.
What motivates people to want to come into the office?
The office remains an important anchor for employees, but the primary purpose of office space is shifting. Two-thirds of employees (66%) say they prefer a hybrid arrangement with the option to access a physical space. When asked what drivers bring employees to the office:
- 74% say: Collaborating with co-workers/clients, building camaraderie, and facilitating in-person meetings
- 16% say: Having a quiet space to focus on getting my work done
- 10% say: Putting in face time with management
How does the perception of technology affect employee sentiment?
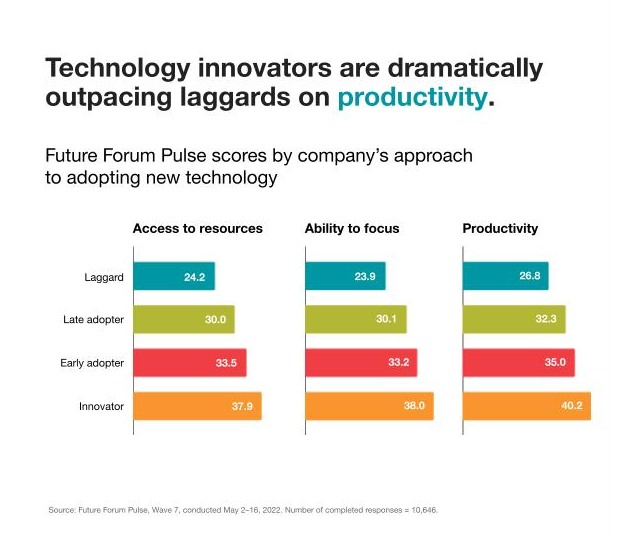
Embracing digital tools is a key component in building connections with employees. Consistent with quarter-over-quarter findings, people who work at companies they describe as technology innovators continue to show higher employee experience scores on all dimensions (compared to those who describe their employers as technology laggards), including
- 1.5x higher scores on productivity
- 2x higher scores on sense of belonging
- 2.5x higher scores on overall satisfaction
How does the perception of transparency affect employee sentiment?
Knowledge workers who believe their employer communicates transparently show markedly higher scores for employee experience and engagement.
- Employees who perceive their companies to be transparent have 12x greater job satisfaction than employees who have the opposite perception.
- Employees who don’t believe their company “is being very transparent regarding post-pandemic remote working policies” are 3.4x more likely to “definitely” look for a new position in the coming year.
- Among executives, 66% believe they are being “very transparent,” but only 43% of employees agree.
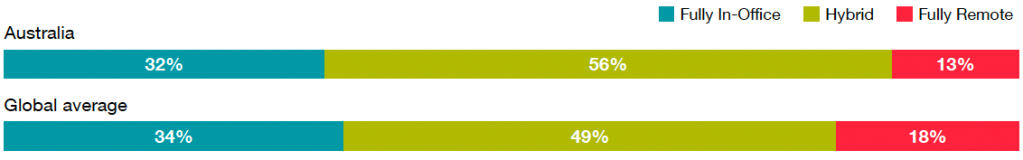
Australia
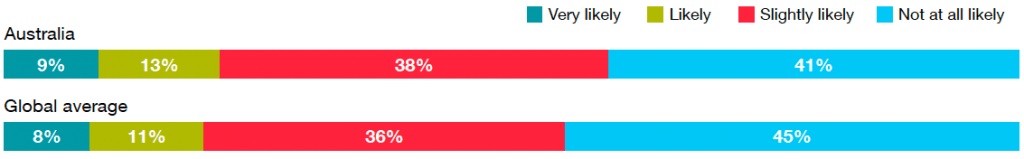
In Australia, more survey respondents are working either fully remote or hybrid, compared to the global average. More workers in Australia say they’re very likely to seek employment at another company in the next 12 months than the global average.
1. Where are people working?
2. How often do people want to work from the office?
I would prefer to work at my company’s office …
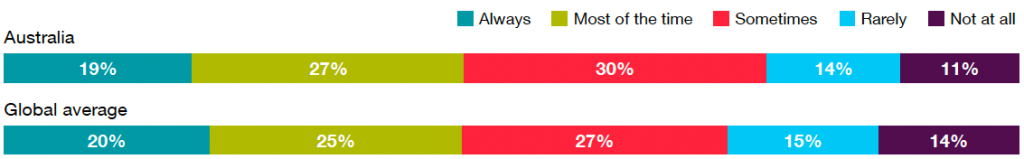
3. What is the desire for schedule flexibility?
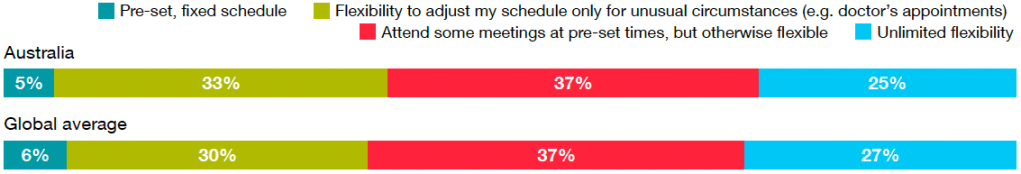
4. How likely are you to look for a new job at another company in the next 12 months?
France
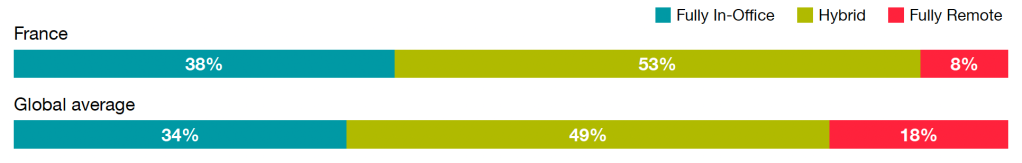
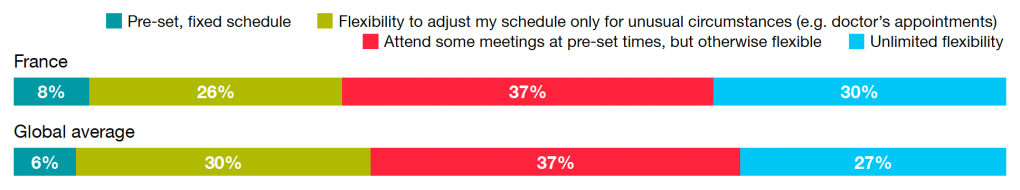
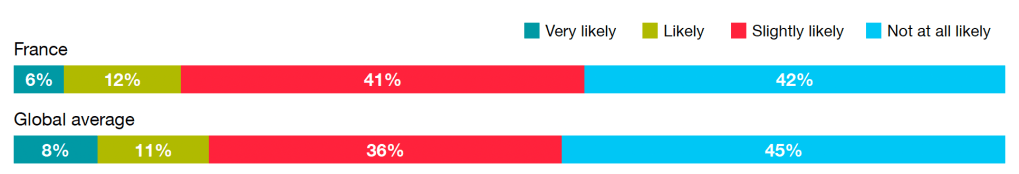
In France, slightly more survey respondents are back in the office full time, compared to the global average. Fewer workers in France say they’re very likely to seek employment at another company in the next 12 months than the global average.
1. Where are people working?
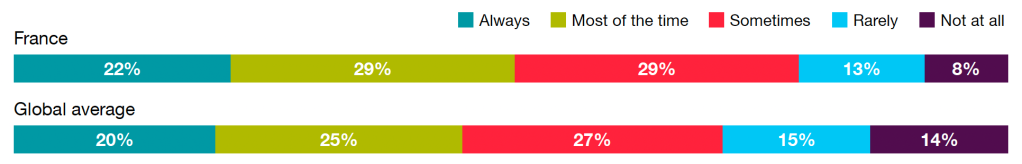
2. How often do people want to work from the office?
I would prefer to work at my company’s office …
3. What is the desire for schedule flexibility?
4. How likely are you to look for a new job at another company in the next 12 months?
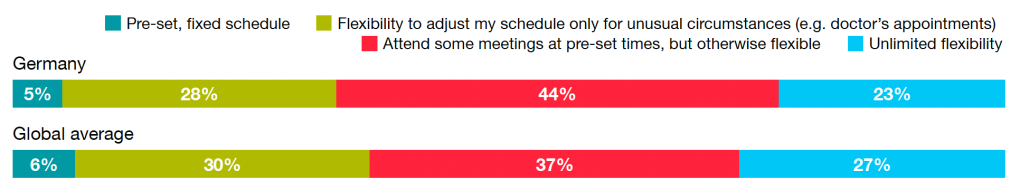
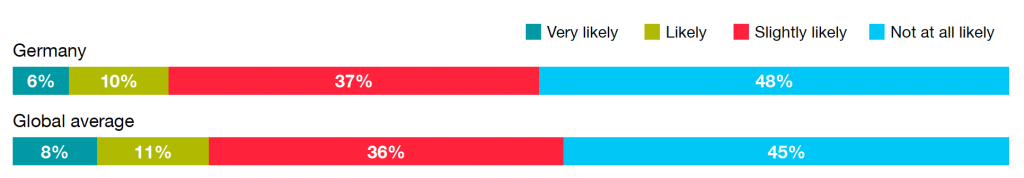
Germany
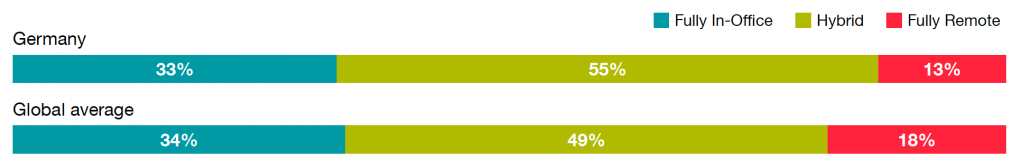
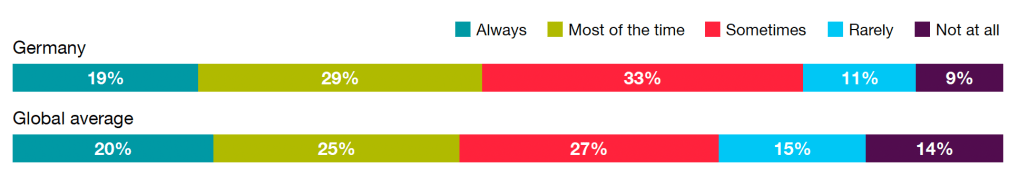
In Germany, more survey respondents are working either fully remote or hybrid, compared to the global average. Fewer workers in Germany say they’re very likely to seek employment at another company in the next 12 months than the global average.
1. Where are people working?
2. How often do people want to work from the office?
I would prefer to work at my company’s office …
3. What is the desire for schedule flexibility?
4. How likely are you to look for a new job at another company in the next 12 months?
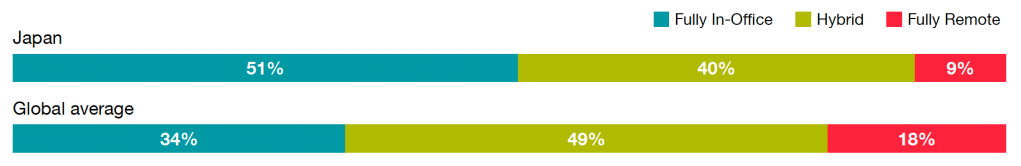
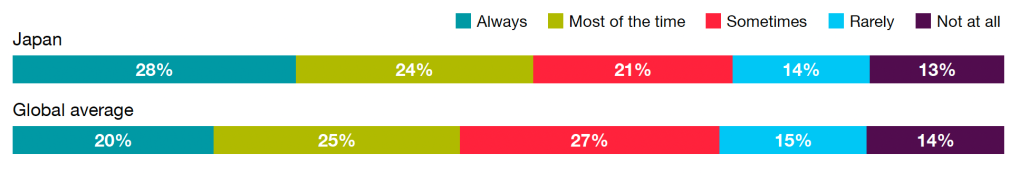
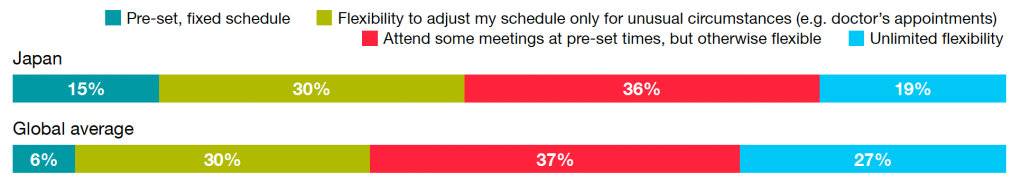
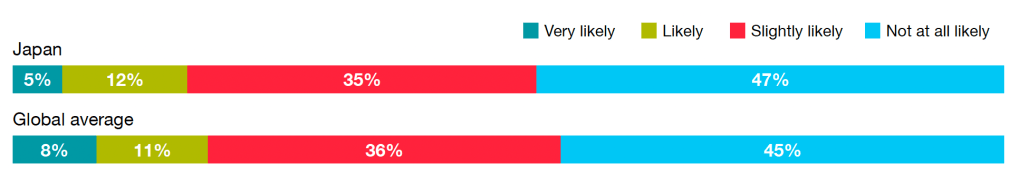
Japan
In Japan, more survey respondents are back in the office full time, compared to the global average. Fewer workers in Japan say they’re very likely to seek employment at another company in the next 12 months than the global average.
1. Where are people working?
2. How often do people want to work from the office?
I would prefer to work at my company’s office …
3. What is the desire for schedule flexibility?
4. How likely are you to look for a new job at another company in the next 12 months?
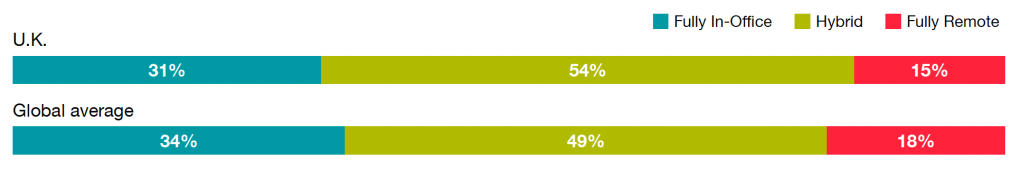
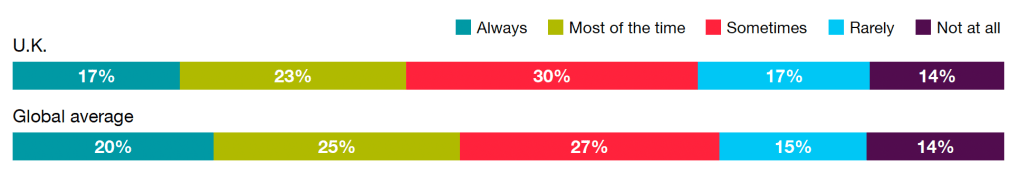
U.K.
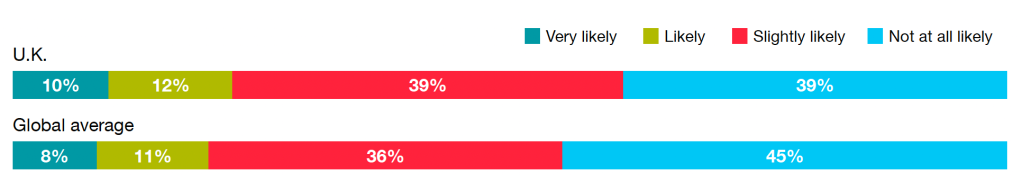
In the U.K, more survey respondents are working either fully remote or hybrid, compared to the global average. More workers in the U.K. say they’re very likely to seek employment at another company in the next 12 months than the global average.
1. Where are people working?
2. How often do people want to work from the office?
I would prefer to work at my company’s office …
3. What is the desire for schedule flexibility?
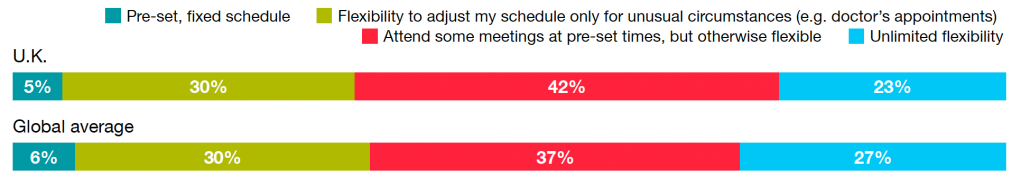
4. How likely are you to look for a new job at another company in the next 12 months?
U.S.
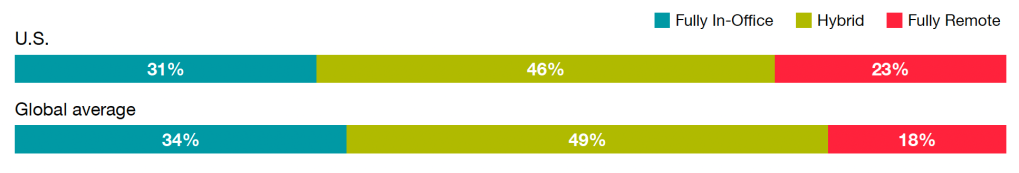
In the U.S., slightly fewer survey respondents are working either fully remote or hybrid, compared to the global average. More workers in the U.S. say they’re very likely to seek employment at another company in the next 12 months than the global average.
1. Where are people working?
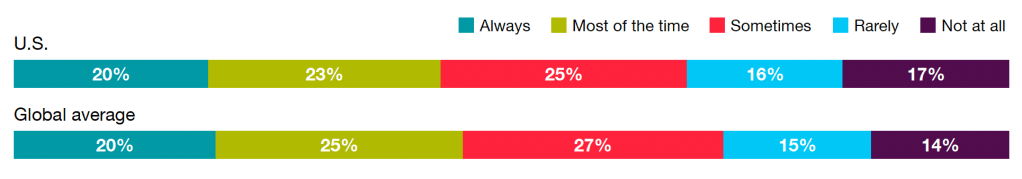
2. How often do people want to work from the office?
I would prefer to work at my company’s office …
3. What is the desire for schedule flexibility?
4. How likely are you to look for a new job at another company in the next 12 months?
Source: Future Forum Pulse, Wave 7, conducted May 2–16, 2022. Number of completed responses = 10,646
Methodology
This Future Forum Pulse surveyed 10,646 knowledge workers in the U.S., Australia, France, Germany, Japan, and the U.K. between May 2–May 16, 2022. The survey was administered by Qualtrics and did not target Slack employees or customers. Respondents were all knowledge workers, defined as employed full-time (30 or more hours per week) and either having one of the roles listed below or saying they “work with data, analyze information or think creatively”: Executive Management (e.g., President/Partner, CEO, CFO, C-suite), Senior Management (e.g., Executive VP, Senior VP), Middle Management (e.g., Department/Group Manager, VP), Junior Management (e.g., Manager, Team Leader), Senior Staff (i.e., Non-Management), Skilled Office Worker (e.g., Analyst, Graphic Designer). The Future Forum Pulse measures how knowledge workers feel about their working lives on a five-point scale (from “very poor” to “very good”) across eight dimensions on an index from -60 (most negative) to +60 (most positive).
10K+
knowledge workers
6
countries