
February 2023
Future Forum Pulse
Our Winter Snapshot of the state of the workplace shows that amid spiking burnout, offering employees flexibility fuels company culture and productivity
Read through the report below or download the PDF.
About the Future Forum Pulse
Future Forum is a consortium focused on building a way of working that is flexible, inclusive, and connected. We conduct research and convene executives to design a people-centered and digital-first workplace.
Since June 2020, Future Forum has conducted quarterly surveys of desk workers and managers across the globe, asking them a series of questions related to the employee experience, including about productivity, sense of belonging, and preferred ways of working.
Each spring and fall, we provide an in-depth report surfacing new findings about desk workers’ experience and expectations. Each summer and winter, we revisit findings from previous quarters and refresh the data to provide a “snapshot” of the state of the workplace.
Key findings
Our Winter Snapshot answers the frequently asked questions business leaders are considering as they plan and implement new workforce policies. The data draws from a survey of 10,243 workers across the U.S., Australia, France, Germany, Japan, and the U.K., conducted from November 16 to December 22, 2022.
Flexibility builds strong organizational cultures
Flexibility counters spiking burnout trends
Flexibility is a key driver for productivity
Pulse Winter Snapshot FAQ
- How we measure the data
- How do employees perceive the state of company culture?
- How connected do employees feel to their companies and organizations?
- What motivates people to want to come into the office?
- How does the perception of transparency affect employee sentiment?
- How does investment in technology affect employee experience?
- How does schedule flexibility impact business results?
- What percentage of the workforce is burned out?
- How does access to flexibility affect burnout?
- How does burnout affect retention?
- Which groups are at the greatest risk of burnout?
- Where are people working?
- Who has access to flexible schedules?
- How do desk workers feel about flexible work?
- How does interest in flexibility differ based on race/ethnicity? (U.S. only)
- How does interest in flexibility differ based on gender/parental status?
How we measure the data
The Future Forum survey uses comparative analysis to gauge how different factors—such as working flexibly—influence employee experience and sentiment, such as sense of belonging, productivity, and ability to focus.
To do this, we ask workers to rate their experience and sentiment on a five-point scale, from “very poor” to “very good.” We use responses to this question to calculate average scores for different groups, and then we compare those groups with one another.
For example, when assessing the effect of flexibility on productivity, we compare the productivity scores of employees with access to flexible working locations and schedules to the productivity scores of employees with fixed, pre-set schedules and working locations.
How do employees perceive the state of company culture?
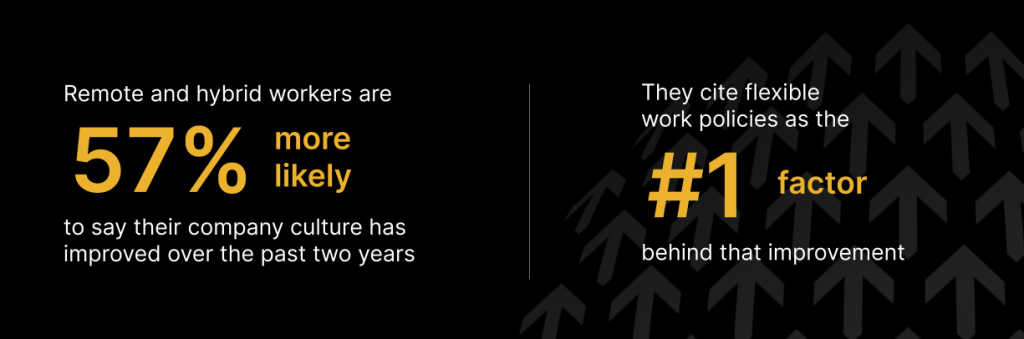
Flexible workers were 57% more likely to say their company culture has improved over the past two years compared with fully in-person workers—and they cite flexible remote work policies as the primary reason their culture is changing for the better.
Despite this progress, 25% of executives surveyed cited “team culture is negatively impacted” as a number one concern about offering employees more flexibility in an office.
How connected do employees feel to their companies and organizations?
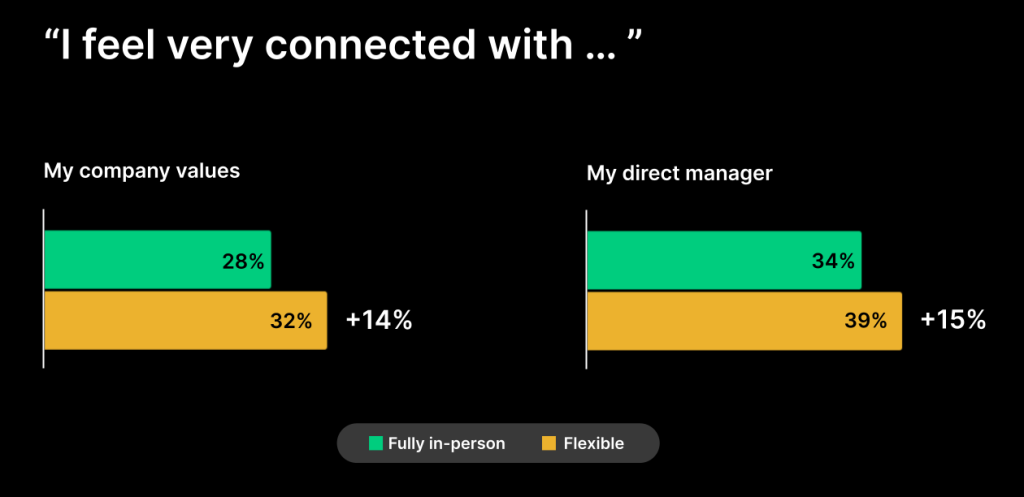
Flexible workers are equally or more likely to feel connected to their immediate teams as fully in-office workers. They are also more likely to feel connected to their direct manager and their company’s values compared with those who are back in the office full-time.
What motivates people to want to come into the office?
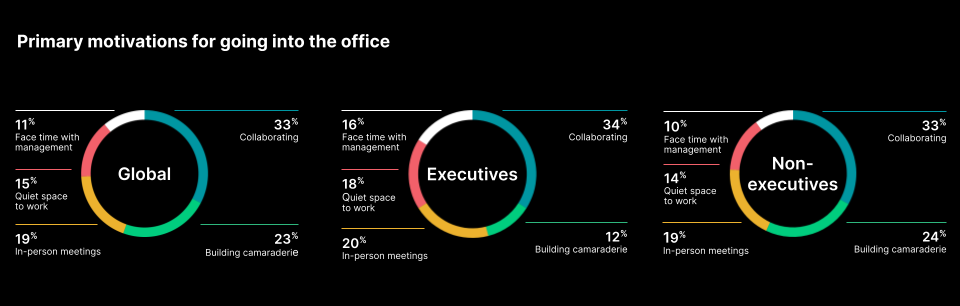
Consistent with past Pulse findings, two-thirds of all workers (67%) say they prefer a hybrid arrangement with the option to access a physical space. The top two drivers motivating employees to want to work in the office are collaboration (33%) followed by building camaraderie (23%).
When looked at by job level, the motivation for coming into the office differs dramatically between executives and non-executives. Executives value putting in face time with management at 1.6x the rate of non-executives. Non-executives value building camaraderie at 2x the rate of executives.
How does the perception of transparency affect employee sentiment?
Transparency—sharing relevant information across all levels of your organization through two-way, ongoing conversation with employees—is key to growing connection and a healthy work culture. Desk workers who believe their employer communicates transparently show markedly higher scores for employee experience and engagement.
How does investment in technology affect employee experience?
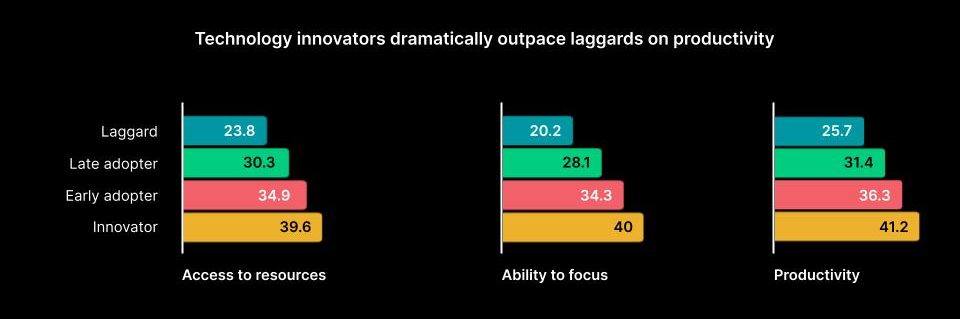
Consistent with quarter-over-quarter findings, people who work at companies they describe as technology innovators continue to show higher employee experience scores on all dimensions (compared with those who describe their employers as technology laggards), including
Technology also impacts burnout levels. Workers who perceive their companies to be laggards—defined as organizations that generally only use technology after it becomes mainstream—are 31% more likely to report feeling burned out at work than those who say the companies they work for are innovators.
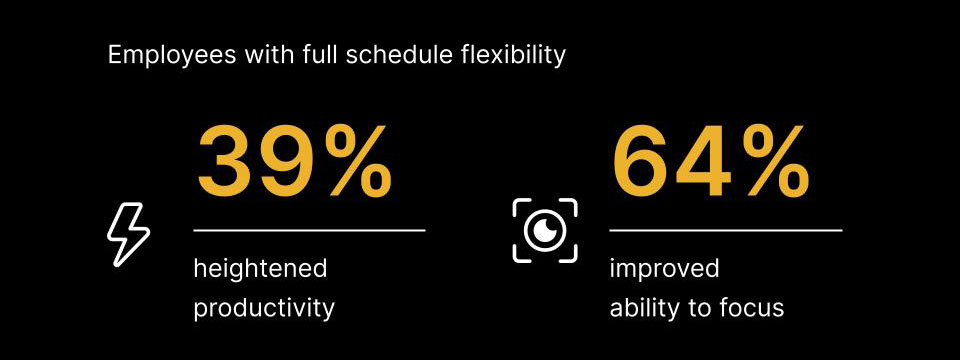
How does schedule flexibility impact business results?
When compared to workers with no ability to shift their schedules, respondents with full schedule flexibility report:
Conversely, a lack of schedule flexibility dramatically impacts both retention and employee experience scores. Employees with rigid work schedules say they are 2.5x more likely to “definitely” look for a new job in the next year compared with workers who have some ability to adjust their schedules. Compared to those with moderate schedule flexibility, desk workers who say they have little to no ability to set their hours report:
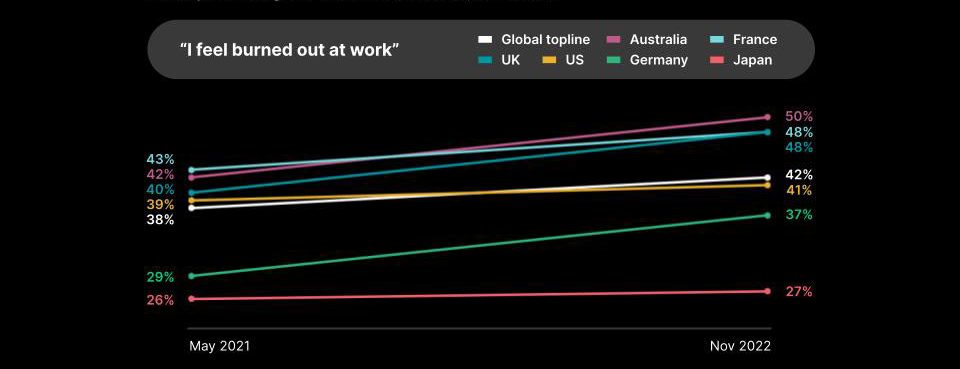
What percentage of the workforce is burned out?
Burnout is still on the rise globally. Forty-two percent of the workforce is reporting burnout—a slight uptick (2% rise) from the previous quarter and an all-time high since May 2021, when Future Forum started measuring burnout.
How does access to flexibility affect burnout?
Fifty-three percent of those who are dissatisfied with their level of flexibility say they are burned out compared to 37% of employees who are satisfied with their level of flexibility. Employees with no ability to shift their schedules are 26% more likely to say they are burned out at work than those with moderate schedule flexibility.
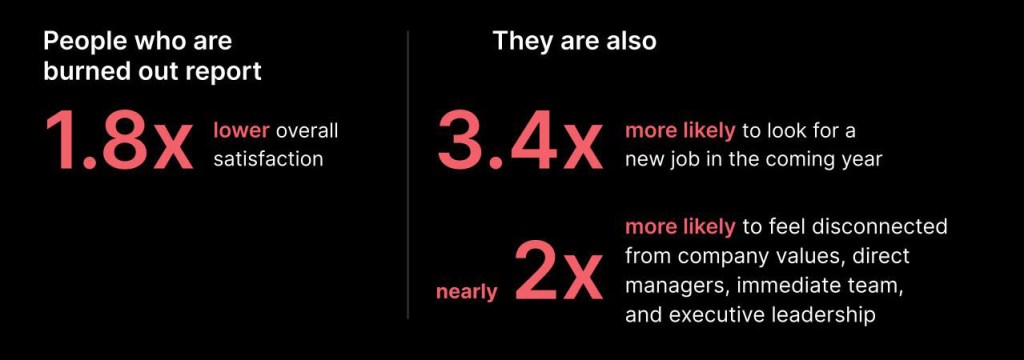
How does burnout affect retention?
Respondents who report they are burned out at work are nearly 3.4x more likely to say they “definitely” plan to look for a new job in the next year than those who say they are not burned out at work.
Which groups are at the greatest risk of burnout?
Age and gender are highly correlated with the likelihood of experiencing burnout, with women and younger people significantly more likely to say they are burned out.
Burnout, defined
According to the World Health Organization, burnout is a syndrome resulting from chronic workplace stress. It is characterized by three dimensions:
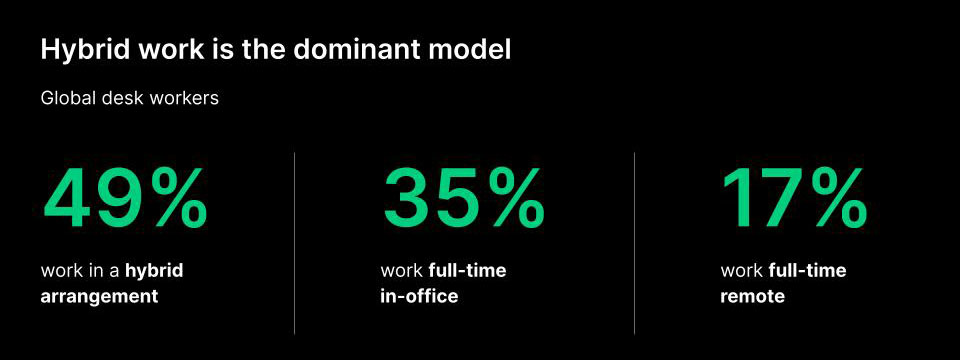
Where are people working?
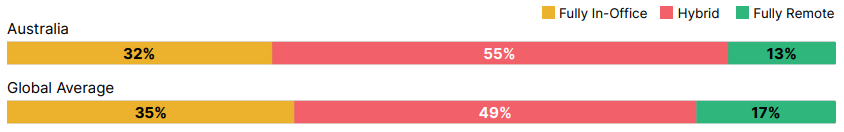
Hybrid work is the dominant model, with 49% of global desk workers working in a hybrid arrangement, compared with 35% working full-time in the office and 17% working full-time remote.
Who has access to flexible schedules?
Fifty-six percent of desk workers say they have little to no ability to adjust their hours from a preset schedule.
The data shows that schedule flexibility is still largely considered a perk or benefit of seniority, with executives significantly more likely to have access to flexible schedules than non-executives.
How do desk workers feel about flexible work?
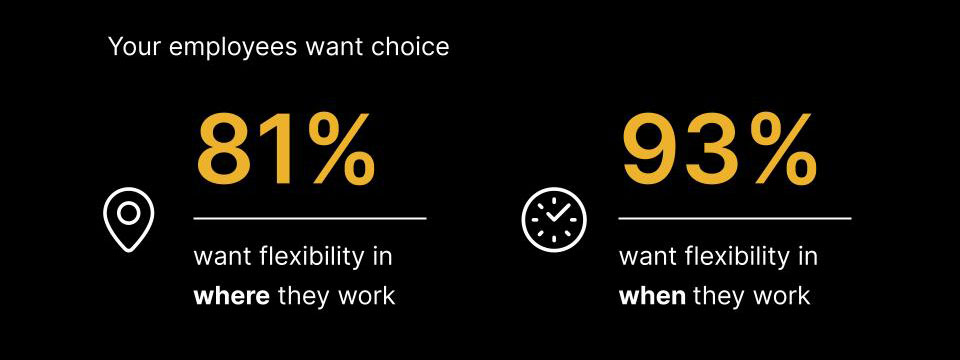
Eighty-one percent of all desk workers now want flexibility in where they work, including a majority (56%) of fully in-office workers.
Ninety-three percent of employees want flexibility in when they work, a continuing trend from Future Forum’s previous quarterly surveys. (However, as noted above, 56% of employees say they have little to no ability to adjust their hours from a preset schedule.)
Fifty-nine percent of employees surveyed are open to looking for a new job in the next year, a 4% increase since the summer. Among those who say they are dissatisfied with their level of flexibility, 75% say they plan to look for a new opportunity within the next year.
Flexibility ranks second only to compensation in determining job satisfaction.
How does interest in flexibility differ based on race/ethnicity? (U.S. only)
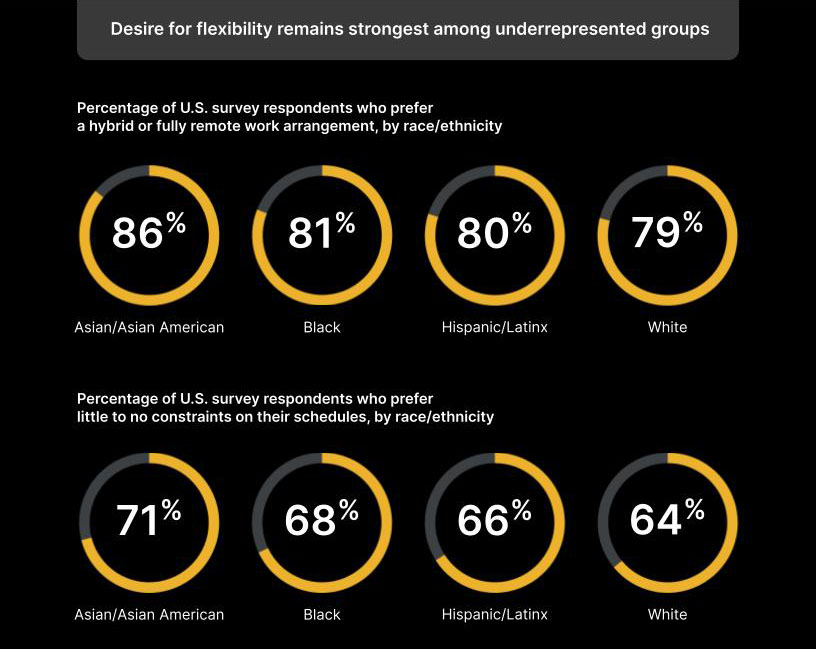
Consistent with our findings quarter over quarter, the desire for flexibility remains strongest among underrepresented groups, including women, working mothers, and people of color.
Based on our recent survey, we continue to see a higher preference for location flexibility among employees of color. The percentage of U.S. respondents by race/ethnicity that prefer these environments: 86% Asian/Asian American, 81% Black, 80% Hispanic/Latinx, and 79% white.
Those same trends play out in preference for schedule flexibility. The percentage of U.S. respondents by race/ethnicity that say they would prefer little to no constraints on their schedule: 71% Asian/Asian American, 68% Black, 66% Hispanic/Latin, and 64% white.
How does interest in flexibility differ based on gender/parental status?
Location flexibility continues to be valuable to parents, including 84% of working mothers. Fifty-nine percent of working mothers say they want to work outside of the office three to five days a week compared with 47% of working fathers.
Sixty-seven percent of parents would prefer little to no constraints on their schedule compared with 62% of non-parents. And 66% of working mothers would prefer little to no constraints on their schedule compared with 69% of working fathers.
Australia
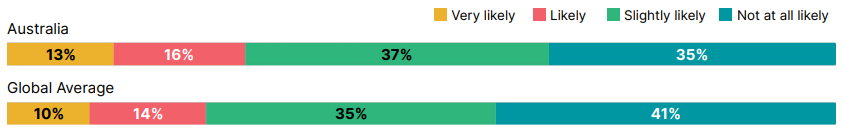
In Australia, more survey respondents are working either fully remote or hybrid, compared with the global average. More workers in Australia say they’re very likely to seek employment at another company in the next 12 months than the global average.
1. Where are people working?
2. What is the desire for location flexibility?
I would prefer to work at my company’s office …
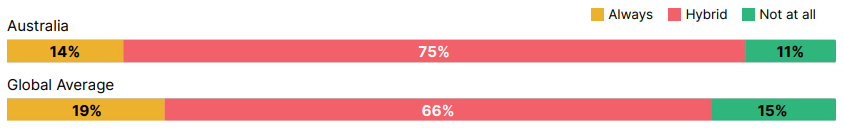
3. What is the desire for schedule flexibility?
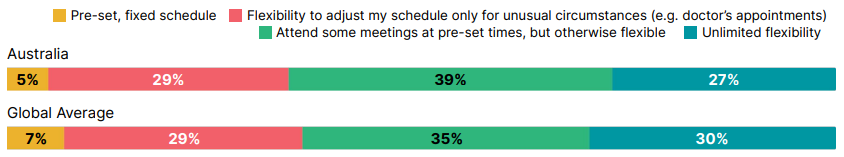
4. How likely are you to look for a new job at another company in the next 12 months?
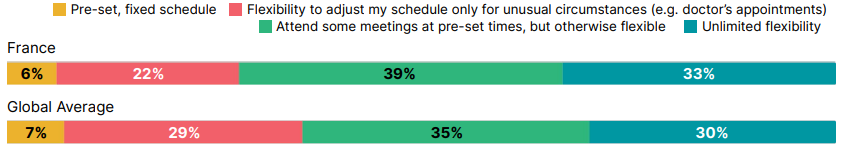
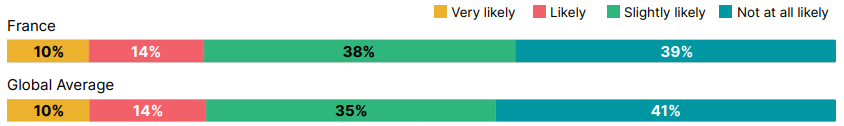
France
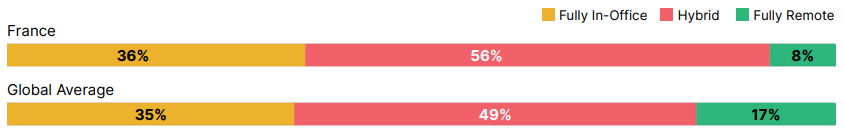
In France, fewer survey respondents are working either fully remote or hybrid, compared with the global average. The same percentage of workers in France say they’re very likely to seek employment at another company in the next 12 months as the global average.
1. Where are people working?
2. What is the desire for location flexibility?
I would prefer to work at my company’s office …
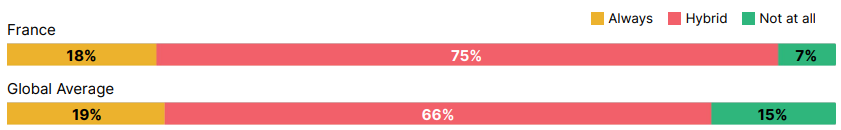
3. What is the desire for schedule flexibility?
4. How likely are you to look for a new job at another company in the next 12 months?
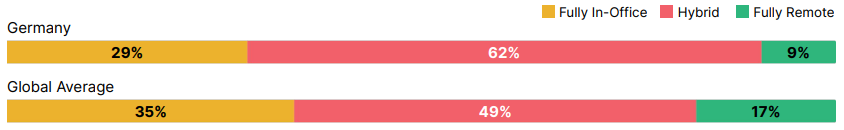
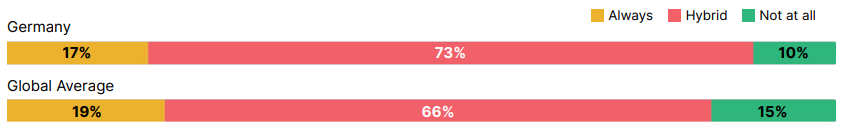
Germany
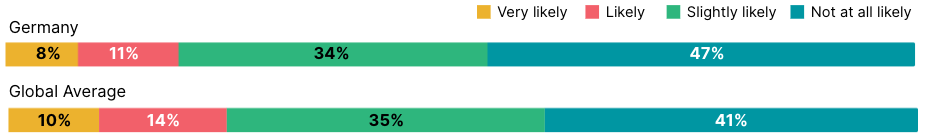
In Germany, more survey respondents are working either fully remote or hybrid, compared with the global average. Fewer workers in Germany say they’re very likely to seek employment at another company in the next 12 months than the global average.
1. Where are people working?
2. What is the desire for location flexibility?
I would prefer to work at my company’s office …
3. What is the desire for schedule flexibility?
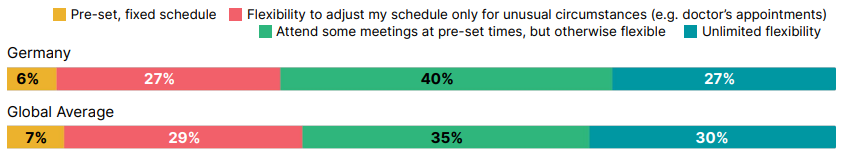
4. How likely are you to look for a new job at another company in the next 12 months?
Japan
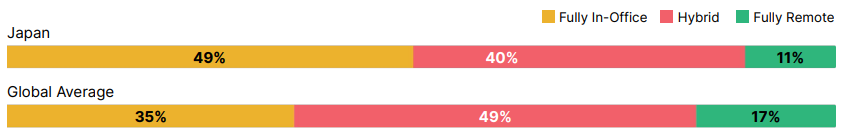
In Japan, fewer survey respondents are working either fully remote or hybrid, compared with the global average. Fewer workers in Japan say they’re very likely to seek employment at another company in the next 12 months than the global average.
1. Where are people working?
2. What is the desire for location flexibility?
I would prefer to work at my company’s office …
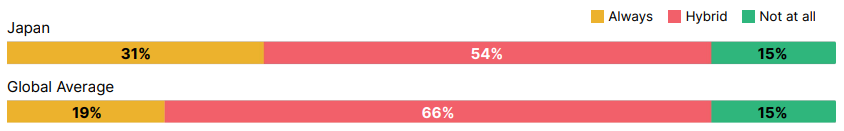
3. What is the desire for schedule flexibility?
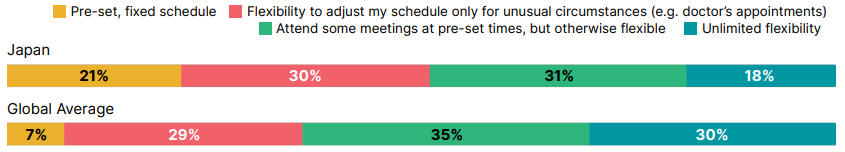
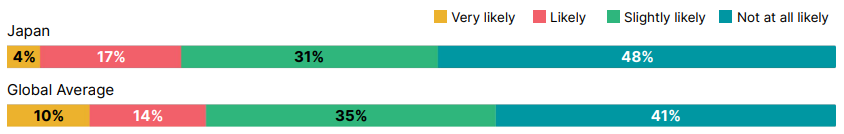
4. How likely are you to look for a new job at another company in the next 12 months?
U.K.
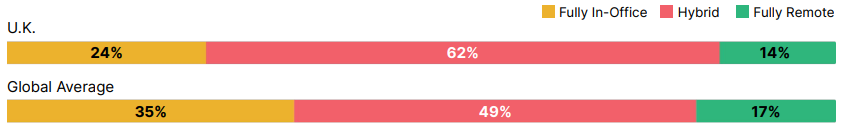
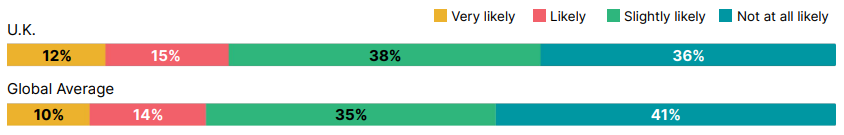
In the U.K., more survey respondents are working either fully remote or hybrid, compared with the global average. More workers in the U.K. say they’re very likely to seek employment at another company in the next 12 months than the global average.
1. Where are people working?
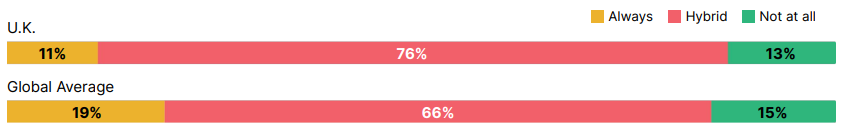
2. What is the desire for location flexibility?
I would prefer to work at my company’s office …
3. What is the desire for schedule flexibility?
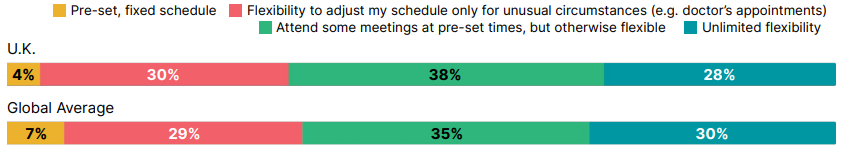
4. How likely are you to look for a new job at another company in the next 12 months?
U.S.
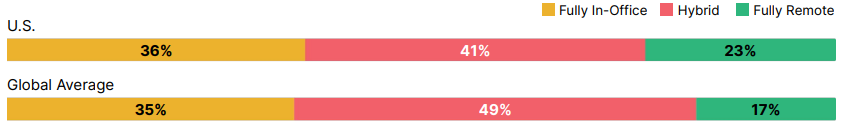
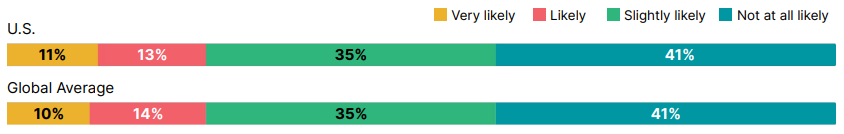
In the U.S., slightly fewer survey respondents are working either fully remote or hybrid, compared with the global average. Slightly more workers in the U.S. say they’re very likely to seek employment at another company in the next 12 months than the global average.
1. Where are people working?
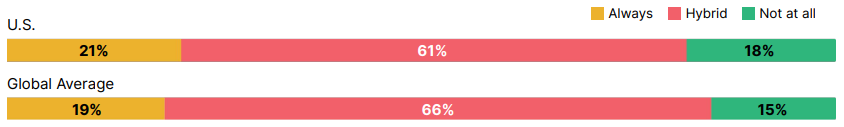
2. What is the desire for location flexibility?
I would prefer to work at my company’s office …
3. What is the desire for schedule flexibility?
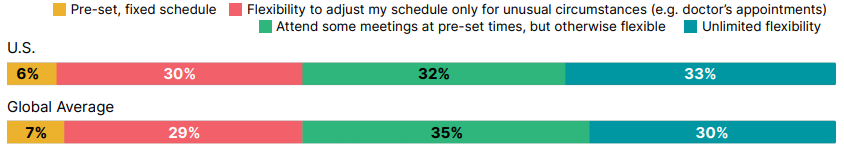
4. How likely are you to look for a new job at another company in the next 12 months?
Source: Future Forum Pulse, Wave 9, conducted Nov 16–Dec 22, 2022. Number of completed responses = 10,243.
Methodology
This Future Forum Pulse surveyed 10,243 workers in the U.S., Australia, France, Germany, Japan, and the U.K. between November 16 and December 22, 2022. The survey was administered by Qualtrics and did not target Slack employees or customers. Survey respondents were all employed full-time (30 or more hours per week) and either holding one of the following roles or saying they “work with data, analyze information or think creatively”: executive management (e.g. president/partner, CEO, CFO, C-suite), senior management (e.g. executive VP, senior VP), middle management (e.g. department/group manager, VP), junior management (e.g. manager, team leader), senior staff (i.e. non-management), skilled office worker (e.g. analyst, graphic designer). For brevity, we refer to the survey population as “desk-based” or “desk workers.” The Future Forum Pulse measures how desk-based workers feel about their working lives on a five-point scale (from “very poor” to “very good”) across eight dimensions on an index from -60 (most negative) to +60 (most positive).
10K+
knowledge workers
6
countries